Show simulated regression data
import numpy as np, pandas as pd
import matplotlib.pyplot as plt

rng=np.random.default_rng(4)
x=rng.uniform(0,10,120)
y=18+7*x+rng.normal(0,8,len(x))Most machine-learning algorithms repeatedly use some combination of similarity, linear combination, probability, partitioning, optimization, averaging, sequential error correction and representation learning.
Given observations
\mathcal D=\{(x_i,y_i)\}_{i=1}^{n},
supervised learning seeks a function
\hat f:X\rightarrow Y
that performs well on unseen observations.
DATA → REPRESENTATION → ALGORITHM → PARAMETERS → PREDICTION → LOSS → LEARNING
feature · target · parameter · hyperparameter · loss · regularization · decision boundary · bias · variance · generalization
Learn weighted combinations.
Linear regression · Logistic regression · Ridge · Lasso
Learn recursive decision rules.
Decision tree · Random forest · Gradient boosting
Nearby observations influence each other.
kNN · kernels · clustering
Find separating boundaries.
SVM
Model uncertainty/distributions.
Naive Bayes · probabilistic models
Discover structure without labels.
k-means · PCA · anomaly detection
Compose learned nonlinear representations.
MLP · CNN · Transformer-style representations
\hat y=\beta_0+\beta_1x_1+\cdots+\beta_px_p
Ordinary least squares minimizes
\text{MSE}=\frac1n\sum_{i=1}^{n}(y_i-\hat y_i)^2.
import numpy as np, pandas as pd
import matplotlib.pyplot as plt
rng=np.random.default_rng(4)
x=rng.uniform(0,10,120)
y=18+7*x+rng.normal(0,8,len(x))from sklearn.linear_model import LinearRegression
X=x.reshape(-1,1)
model=LinearRegression().fit(X,y)
fig,ax=plt.subplots(figsize=(7,4))
ax.scatter(x,y,alpha=.45)
order=np.argsort(x)
ax.plot(x[order],model.predict(X)[order],linewidth=2)
ax.set(title="Linear regression: learn the best weighted line",
xlabel="Advertising spend",ylabel="Sales")
plt.show()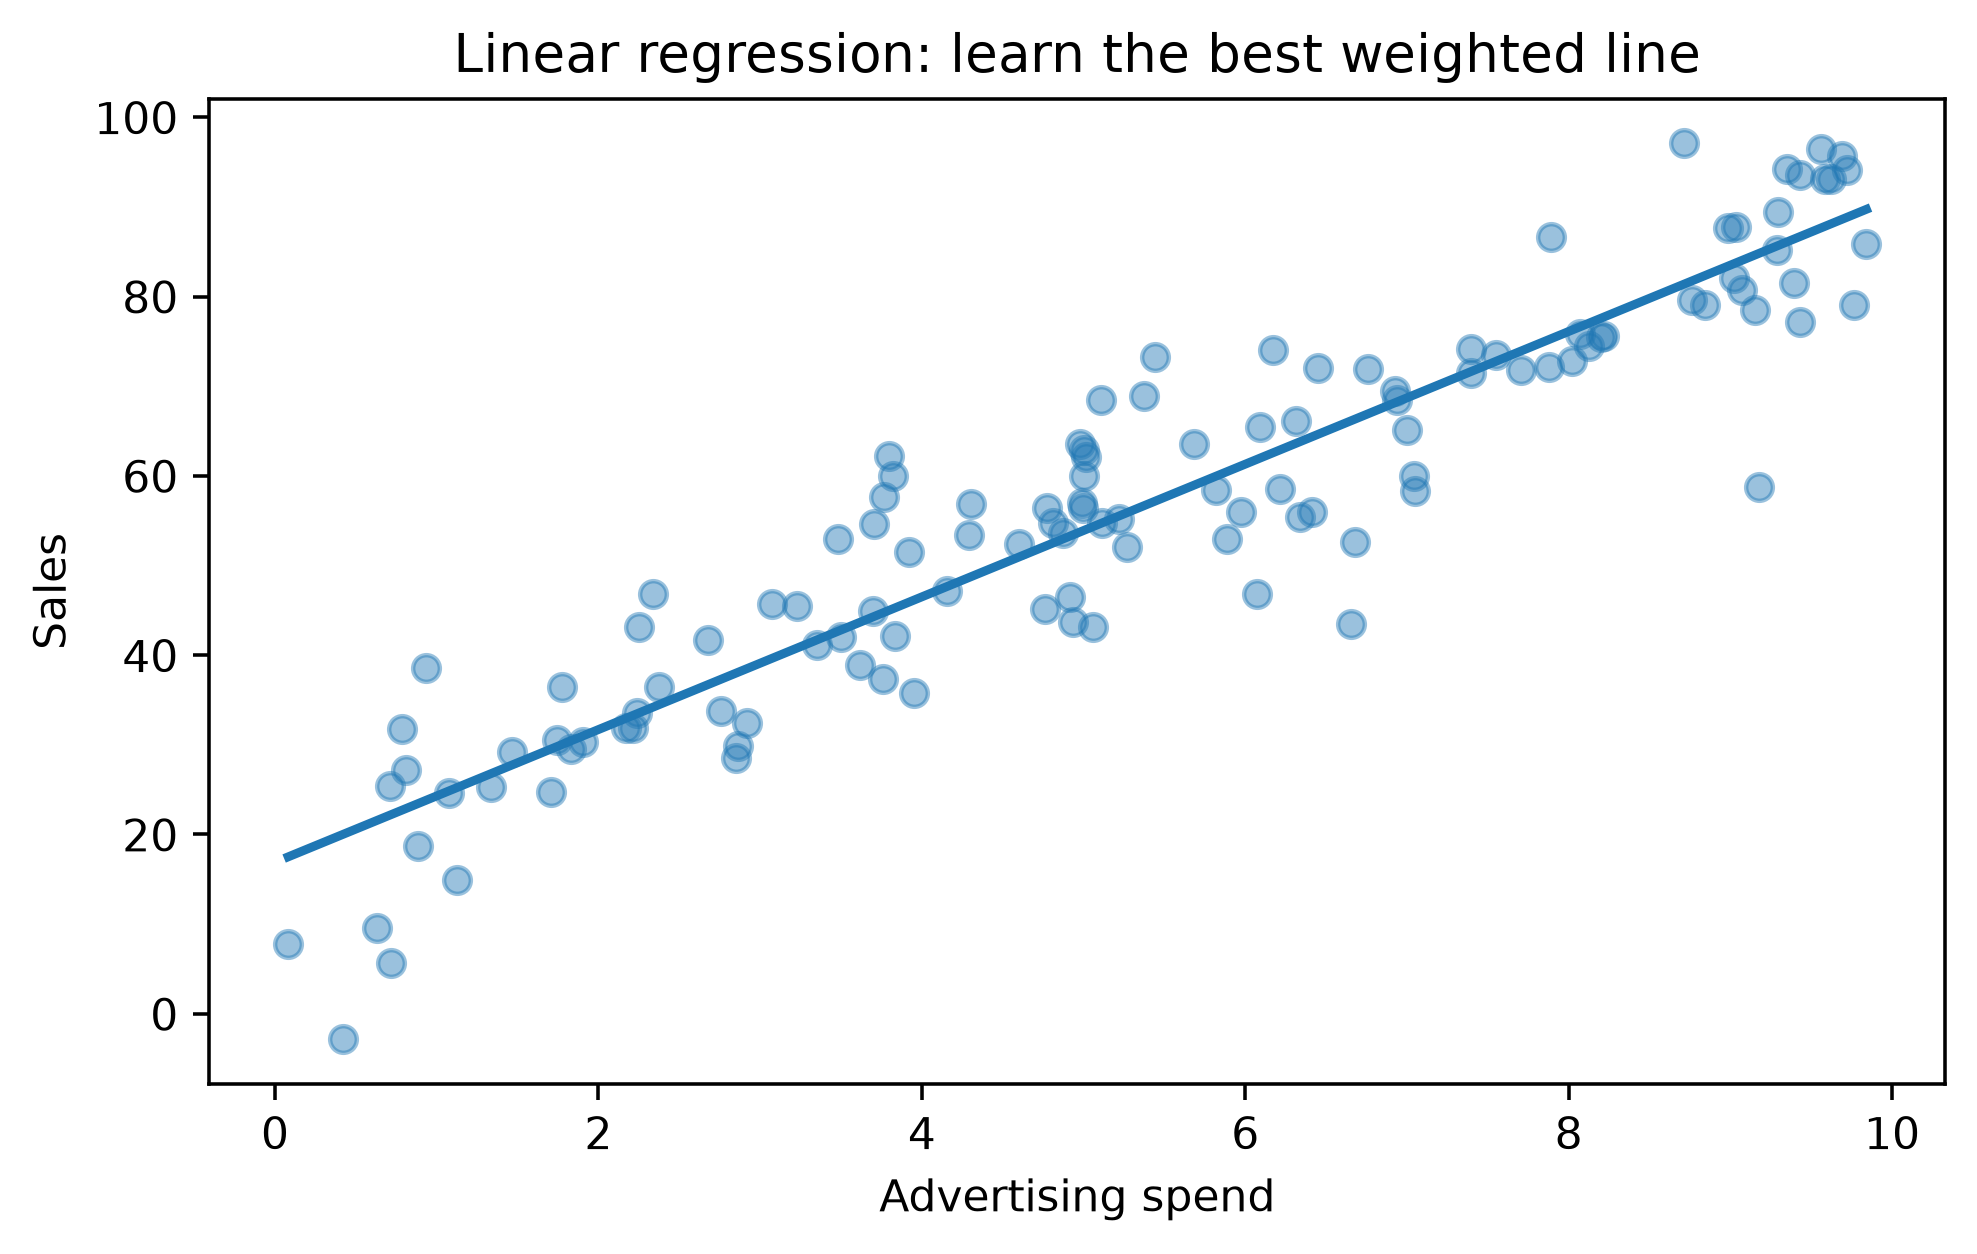
Many algorithms learn parameters by moving downhill on a loss:
\theta_{t+1}=\theta_t-\eta\nabla_\theta L(\theta_t).
η is the learning rate.
Gradient descent appears far beyond linear regression: logistic models, neural networks and many differentiable learning systems repeatedly optimize a loss by following gradients.
z=\beta_0+\beta^Tx
P(Y=1\mid x)=\sigma(z)=\frac{1}{1+e^{-z}}.
The model is linear in log-odds, not probability.
from sklearn.datasets import make_classification
from sklearn.linear_model import LogisticRegression

Xc,yc=make_classification(
    n_samples=700,n_features=2,n_redundant=0,
    n_clusters_per_class=1,class_sep=1.15,random_state=7
)
clf=LogisticRegression().fit(Xc,yc)
Use logistic regression as a highly valuable classification baseline—especially when calibrated probabilities and coefficient interpretation matter.
For classification:
\hat y(x)=\operatorname{mode}\{y_i:i\in N_k(x)\}.
The central question becomes:
What does nearby mean?
from sklearn.neighbors import KNeighborsClassifier
knn=KNeighborsClassifier(n_neighbors=5).fit(Xc,yc)kNN exposes why feature scaling matters. If salary ranges into hundreds of thousands while another feature ranges from 0–1, Euclidean distance can become mostly “salary distance.”
A tree repeatedly asks questions such as:
support_tickets > 3?
        /        \
      yes        no
     /            \
tenure < 6?     low risk
For classification, splits commonly reduce impurity. Gini impurity is
G=1-\sum_{k=1}^{K}p_k^2.
from sklearn.tree import DecisionTreeClassifier, plot_tree

tree=DecisionTreeClassifier(max_depth=3,random_state=2).fit(Xc,yc)
fig,ax=plt.subplots(figsize=(10,5))
plot_tree(tree,filled=True,ax=ax)
plt.show()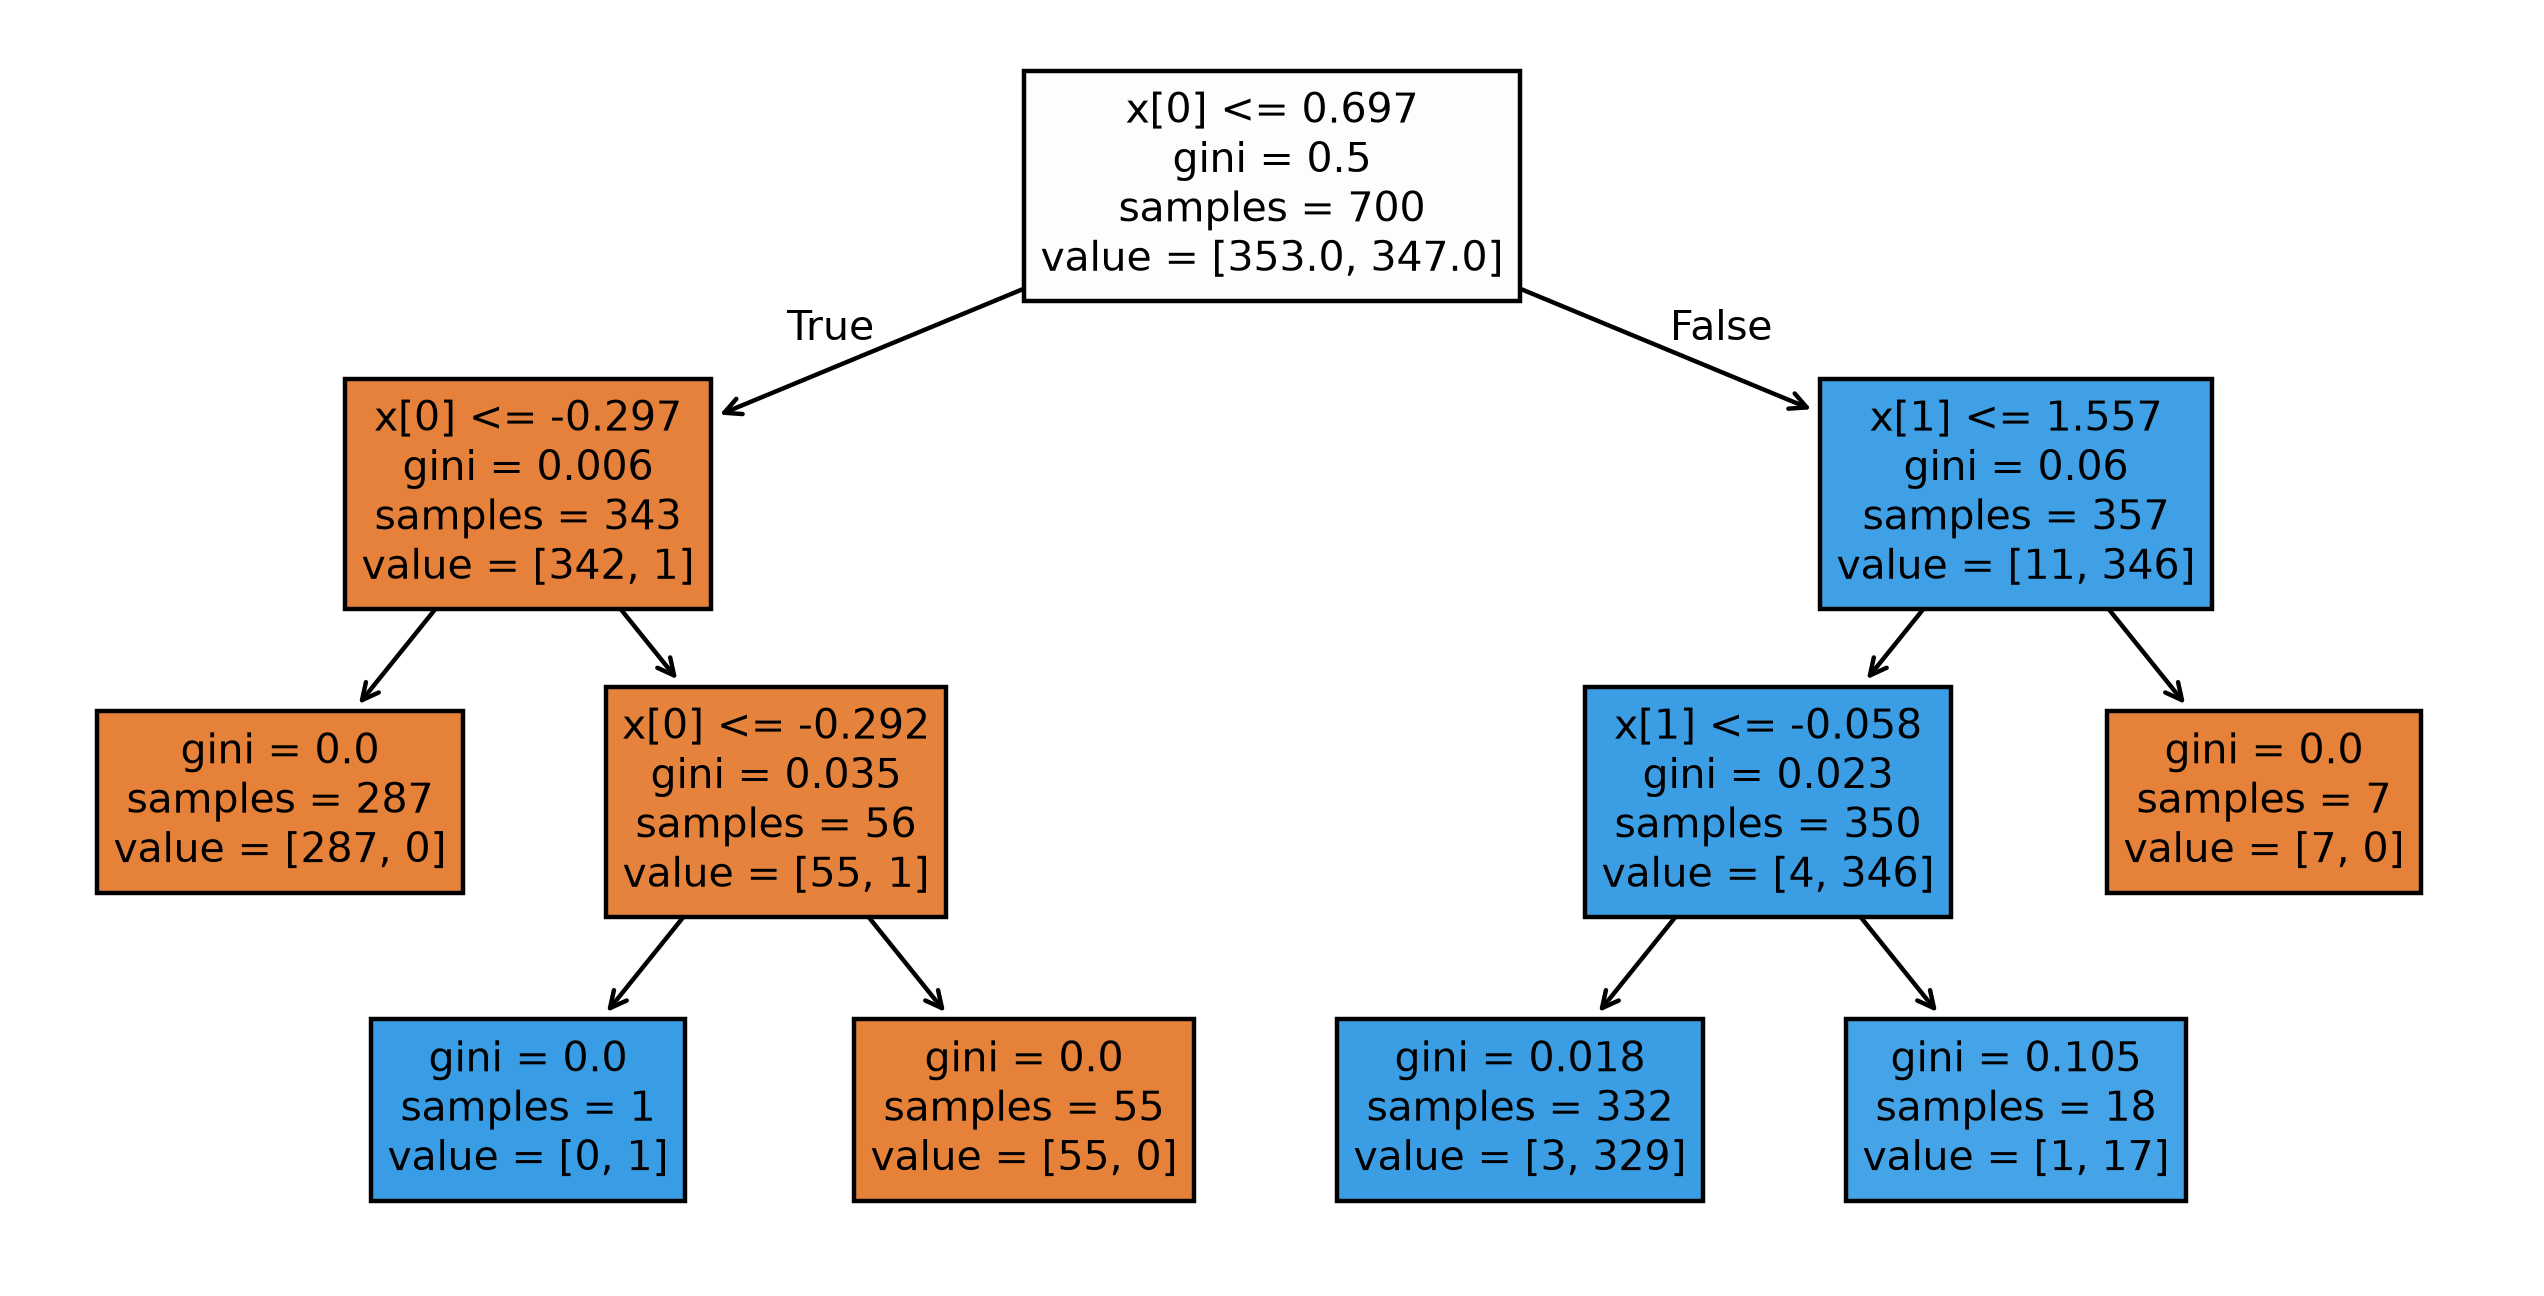
Trees naturally learn:
But a deep tree can memorize training data.
A random forest trains many randomized trees and aggregates predictions:
\hat f(x)=\frac1B\sum_{b=1}^{B}\hat f_b(x)
for regression, with voting/probability averaging for classification.
The recurring idea is variance reduction through averaging.
from sklearn.ensemble import RandomForestClassifier

rf=RandomForestClassifier(
    n_estimators=300,
    max_features="sqrt",
    random_state=42
)
rf.fit(X_train,y_train)Boosting builds an additive model:
F_M(x)=F_0(x)+\sum_{m=1}^{M}\eta h_m(x).
Each new learner is chosen to improve what the current ensemble gets wrong.
Random forest / bagging: build many diverse learners largely independently → average.
Boosting: build learners sequentially → each corrects the current ensemble.
Common modern tabular implementations include gradient-boosted trees such as XGBoost, LightGBM and CatBoost.
For a linear separator:
w^Tx+b=0.
SVMs seek a boundary with a large margin, with regularization controlling the tradeoff between margin and violations.
Kernel methods allow nonlinear boundaries through similarity in an implicit feature space.
Good conceptual lesson:
The training points nearest the boundary can matter much more than distant points.
P(y\mid x_1,\dots,x_p) \propto P(y)\prod_jP(x_j\mid y).
The conditional-independence assumption is “naive,” yet the method can be surprisingly effective, especially for sparse text/count features.
k-means minimizes within-cluster squared distance:
\sum_{k=1}^{K}\sum_{x_i\in C_k}\|x_i-\mu_k\|^2.
from sklearn.datasets import make_blobs
from sklearn.cluster import KMeans

Xu,_=make_blobs(n_samples=700,centers=4,cluster_std=.8,random_state=12)
km=KMeans(n_clusters=4,n_init="auto",random_state=12).fit(Xu)

fig,ax=plt.subplots(figsize=(6,5))
ax.scatter(Xu[:,0],Xu[:,1],c=km.labels_,alpha=.45)
ax.scatter(km.cluster_centers_[:,0],km.cluster_centers_[:,1],
           marker="X",s=180)
ax.set_title("k-means: discover geometric groups")
plt.show()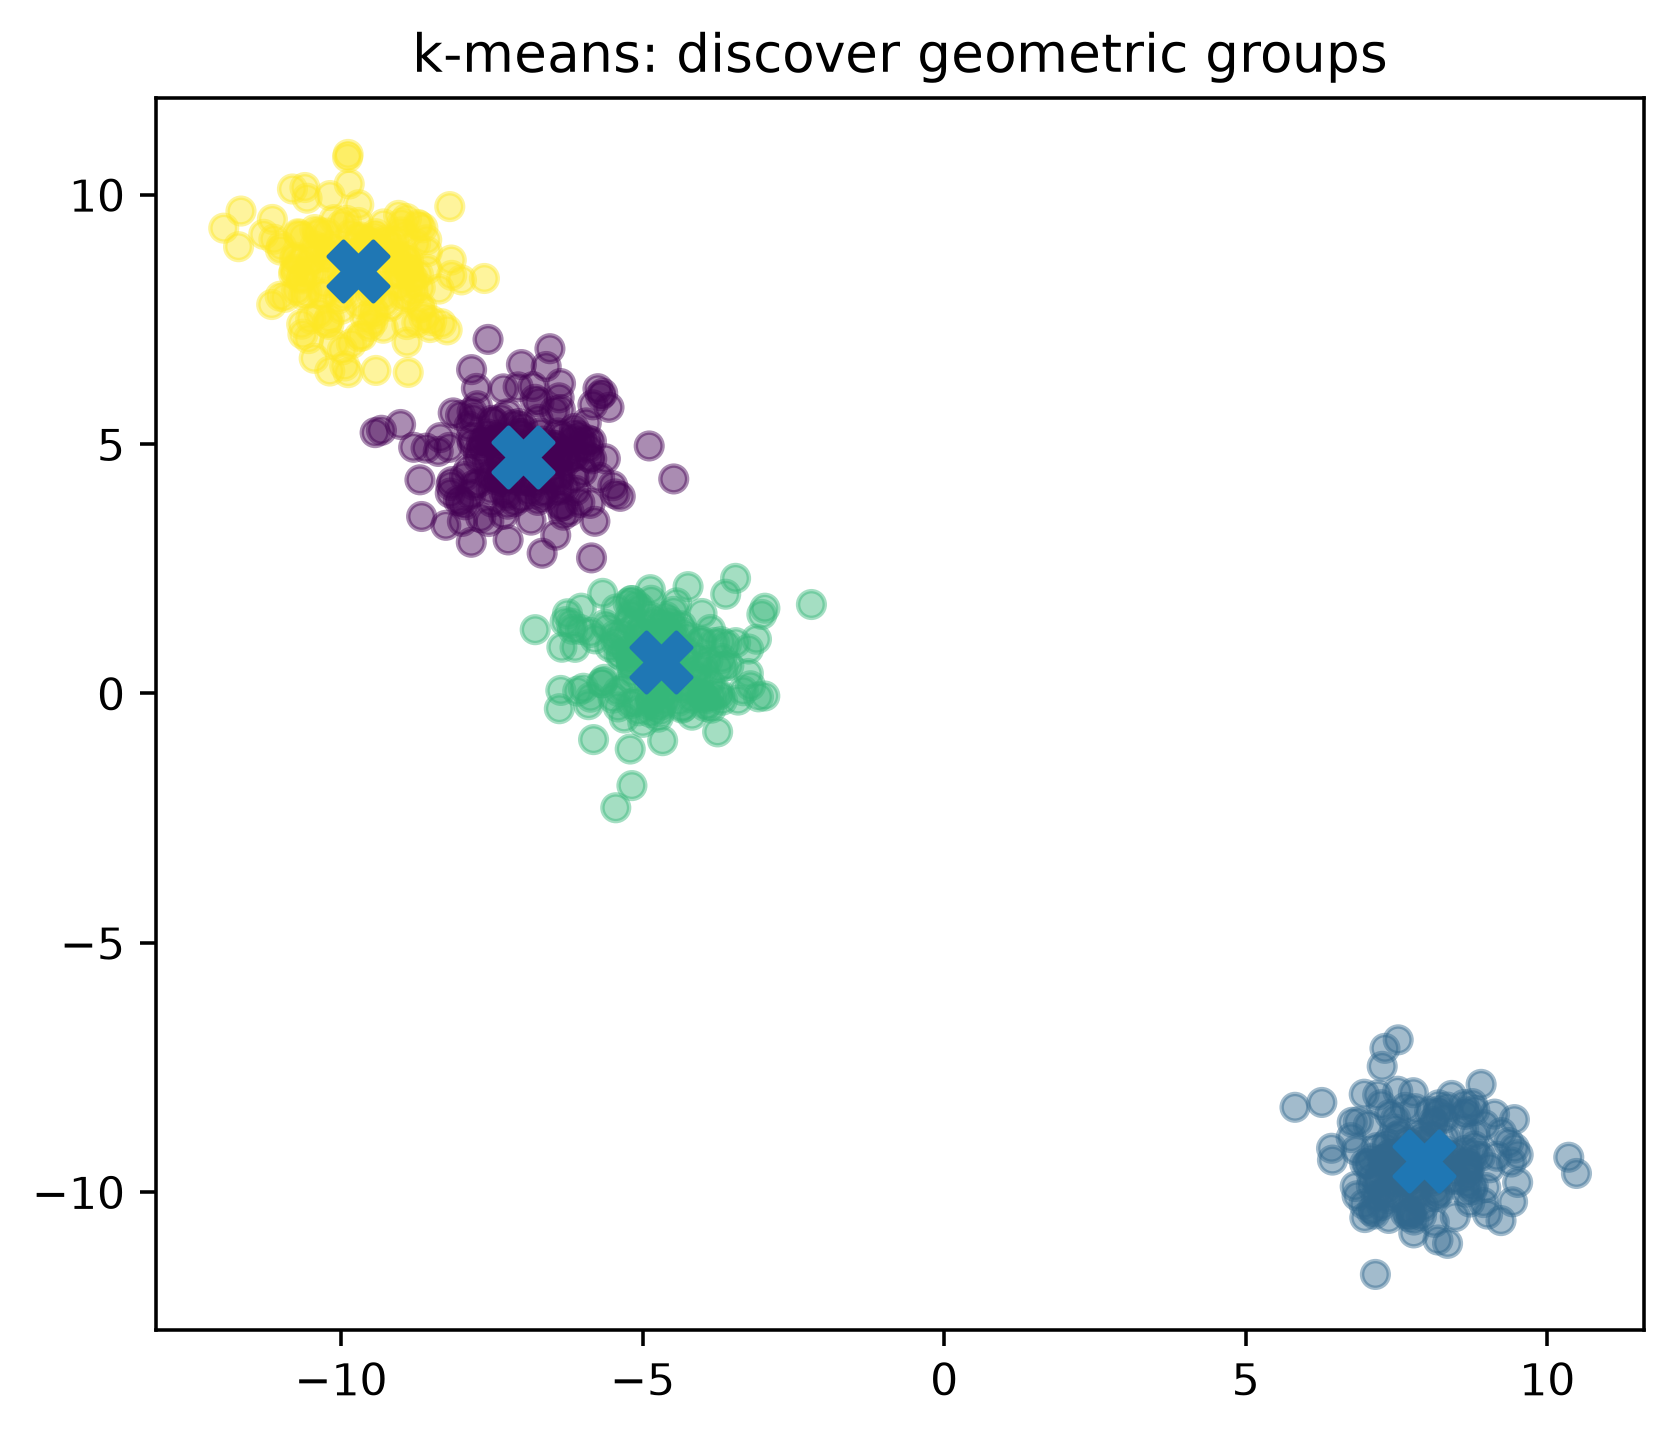
Clusters are mathematical groupings—not automatically real customer personas.
PCA creates orthogonal directions maximizing variance.
For centered X, principal directions come from eigenvectors of its covariance matrix or equivalently an SVD.
z_1=w_1^Tx.
Use for:
Do not automatically assume “largest variance = most predictive.”
A neuron computes
h=\phi(w^Tx+b).
Layers compose these operations:
x\rightarrow h_1\rightarrow h_2\rightarrow\cdots\rightarrow\hat y.
The major conceptual difference is that neural networks can learn representations and predictors jointly.
Ridge:
L_{\text{ridge}}=L+\lambda\sum_j\beta_j^2.
Lasso:
L_{\text{lasso}}=L+\lambda\sum_j|\beta_j|.
Regularization encodes the preference:
Fit the data—but not with arbitrary complexity.
This idea recurs in linear models, trees, boosting and neural networks under different names and mechanisms.
Expected prediction error can be understood conceptually as
\text{Error}\approx \text{Bias}^2+\text{Variance}+\text{Irreducible Noise}.
| Situation | Strong starting points |
|---|---|
| Interpretable regression | Linear/Ridge |
| Interpretable classification | Logistic regression |
| Tabular nonlinear data | Gradient boosting / Random forest |
| Strong simple baseline | Linear/logistic + tree ensemble |
| Sparse text baseline | Logistic regression / Naive Bayes |
| Local similarity matters | kNN |
| Unlabeled grouping | k-means |
| Dimensional compression | PCA |
| Images/audio/text at scale | neural representation models |
Start with the data structure, target, sample size, constraints, interpretability, latency and validation design. Then compare credible baselines empirically.
LINEARITY → PROBABILITY → DISTANCE → TREES → ENSEMBLES → UNSUPERVISED STRUCTURE → REPRESENTATION LEARNING
The recurring ideas matter more than memorizing model names:
When you meet a new algorithm, ask:
What does it optimize? What representation does it assume? How does it control complexity? What kinds of structure can it express?